
I had an interesting question from a customer that I am currently working with.
They said, ‘In Azure SQL DB I can see the number of deadlocks very easily in a graphical manner – why can’t I do that on premises?’
I thought for a minute and a plan developed. Why not use the System Health Extended Event session to grab the xml_deadlock_reports and provide a Power BI Report that would allow you to easily display deadlock information.
So, Deadlock Dashboard was conceived.
First I needed a data source for Power BI that would allow me to display counts by day as well as drill into the details.
In a previous post I explained how to parse the xml returned from Extended Events to produce a rowset. Minor tweaks and sp_GetDeadlockInfo was created. Yes! I know the naming convention best practice… I intend for this to be deployed to master database.
First we have to get the LOG directory where the .xel files are stored for the system health extended event session
[code lang=”SQL”]
— this algorithm assumes that you have not significantly modified the path for the LOG directory.
— i.e. it is at the same path and level as the \data directory. If not, you will have to modify this code
— or hardcode the path for each instance when you create the stored procedure.
SET NOCOUNT ON;
DECLARE @path nvarchar(255) = ”;
— First get the default path for DATA
SET @path = CAST(SERVERPROPERTY(‘instancedefaultdatapath’) AS nvarchar(255));
— strip off the data\ and add log\system_health*.xel
SET @path = REVERSE(SUBSTRING(REVERSE(@path),6,LEN(@path)))+’log\system_health*.xel’;
—
[/code]
Next we have to obtain the event payloads from the .xel files
Then we use the .value and .query methods of the xml datatype to produce our rowset.
[code lang=”SQL”]
— Now retrieve any xml_deadlock_reports from the system health .xel files
— NOTE: These are set up to rollover when full so you can wind up missing events
WITH DeadlockDetails (DeadlockInfo) AS
(
SELECT CAST(C.query(‘.’) AS XML) as DeadlockInfo
FROM (SELECT
CAST(event_data AS XML) AS XMLDATA
FROM
sys.fn_xe_file_target_read_file(
@path, null, null, null)) a
CROSS APPLY a.XMLDATA.nodes(‘/event’) as T(C)
WHERE C.query(‘.’).value(‘(/event/@name)[1]’, ‘varchar(255)’) = ‘xml_deadlock_report’
)
— Now parse the data so we can consume it in Power BI
SELECT
SERVERPROPERTY(‘servername’) as [Server Name]
,DeadlockInfo.value(‘(//event/@timestamp)[1]’,’datetime’) AS [TimeStamp]
,DeadlockInfo.value(‘(//data/value/deadlock/process-list/process/@id)[1]’,’varchar(255)’) AS [Process ID]
,DeadlockInfo.value(‘(//data/value/deadlock/process-list/process/@hostname)[1]’,’varchar(255)’) AS [Host Name]
,DeadlockInfo.value(‘(//data/value/deadlock/process-list/process/@currentdbname)[1]’,’varchar(255)’) AS [Database Name]
,DeadlockInfo.value(‘(//data/value/deadlock/process-list/process/@isolationlevel)[1]’,’varchar(255)’) AS [Isolation Level]
,DeadlockInfo.value(‘(//data/value/deadlock/process-list/process/inputbuf)[1]’,’varchar(max)’) AS [Input buffer 1]
,DeadlockInfo.value(‘(//data/value/deadlock/process-list/process/inputbuf)[2]’,’varchar(max)’) AS [Input buffer 2]
,DeadlockInfo.query(‘(//data/value/deadlock)[1]’) AS [Raw Data]
—
[/code]
NOTE: You can find the source code and the pbix file at my GitHub repo – You will have to open the pbix file in Power BI Desktop and Edit the datasource to point to the instance where you installed sp_GetDeadlockInfo
https://github.com/bobtaylor29708/DeadlockDashboard
You can in fact add a data source parameter with a dropdown list that would allow you to use this report for multiple instances.
To do this you can follow these simple steps. The first few steps are a one time operation
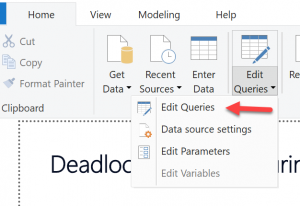
1. Create a parameter and provide the list of values. Open the report in Power BI Desktop then select Edit Query from the Edit Query Menu
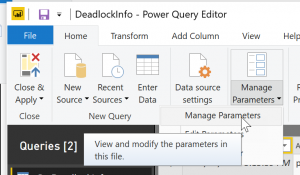
2. Then in the Manage Parameters menu select Edit Parameters
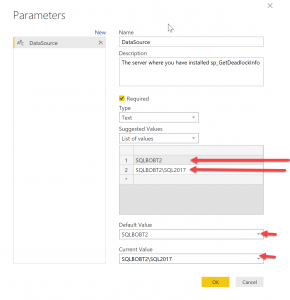
3. In the Parameters dialog add as many items to the list as you want to support (be sure to CREATE sp_GetDeadlockInfo on each one!)
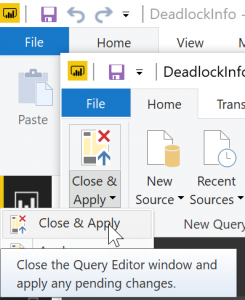
4. Close and apply to save your changes.
Now when you want to run the report for a different data source, on the Edit Queries menu select Edit parameters and then choose your data source
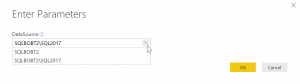
Once the data source has been refreshed you should have a display that look like this
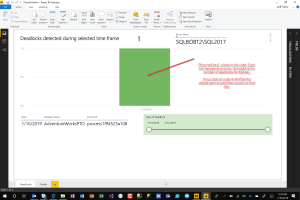
Clicking on the bar corresponding to the date, you will filter the details area. Additionally you may use the slider to limit the days being displayed
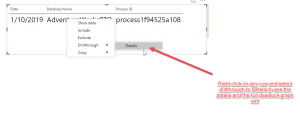
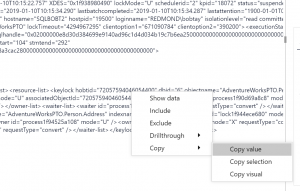
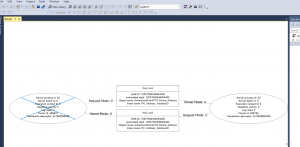
The full XML payload for an XML Deadlock Graph is available on the details page. Simply copy, paste into Notepad and save it with the .xdl extension. You can then double click and SSMS will display the graphical representation.
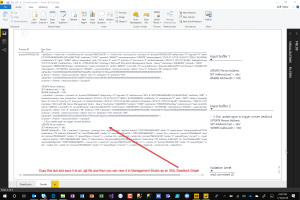
To do that, right-click in the raw data field and select copy value
There you have it! Please provide any feedback you might have!
Recent Comments